Contents
Methodology & Regions
Findings
Spending Analytics
Location Analytics
About Moneris Data Services
Methodology
Moneris Data Services examined Consumer Spending and Location trends prior-to and during COVID, from Jan 2019 to Oct 2021.
Three Mountainous Tourist Regions known for Summer and Winter vacations were compared. This report represents the main findings of this study.
Metrics such as Total Spend Volume, and the number of Transactions is based on payment data measured across representative Moneris Merchants, with a focus on Tourist Industries including: Retail, Restaurant, Hotel and Entertainment.
Origin of Spend (Domestic and International), showing where Tourist came from is determined using proprietary Moneris Data Technologies.
All data, metrics, and findings are anonymized and made private to protect all stakeholders, merchants, and purchasers, over-andabove necessary regulations and privacy protections.
Regions
The following regions were studied from Jan 2019 to Oct 2021.
Rockies
- Jasper
- Banff
- Whistler
- Revelstoke
Collingwood
- Blue Mountains
- Collingwood area
Laurentians
- Mont Tremblant
- Charlevoix
- Mont St. Anne
Findings
- Mountain Destinations in Canada have seen strong recovery post COVID, as international travel remains less desirable, domestic travelers are taking advantage, spending more in these regions, in verticals like retailers & hotels
- Spending and transactions have begun to recover in 2021, however Collingwood still remains lower
- Average Ticket Size is higher than 2020, but average spend per transaction is still lower than 2019, pre-COVID
- Key Verticals have grown since lockdowns ended, with Retailers and Hotels seeing larger spikes in spending growth
- Maintaining domestic customers and re-attracting international is key to growing post-COVID, into 2022
- Merchants in these markets should consider driving and attracting continued domestic visitation
- International spend is higher than domestic and remains a growth opportunity in all markets post-COVID
- Ontario, Quebec, and Western travelers were spending more in their home provinces during COVID in 2020
- The number of nights stay at these destinations is rising across markets suggesting longer stays of domestic customers
Consumer Spending Analytics
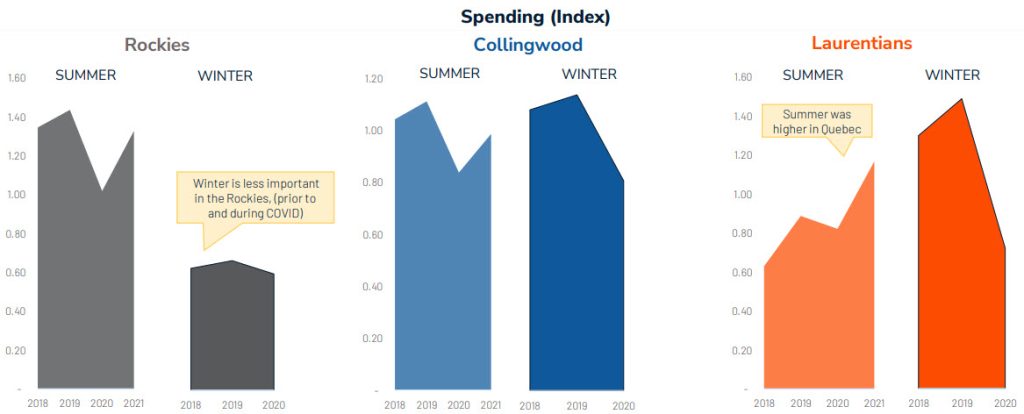
Consumer Spending Recovered After COVID Impact
- COVID’s impact was deepest during peak lockdown periods in Mar-Apr 2020, Oct 2021, and Jan-Feb 2021
- Recovery in spending (total volume) was higher overall (0.5x-1.5x) than earlier declines (0.5x-1x)
- Blue Mountains still has opportunity to grow recovery

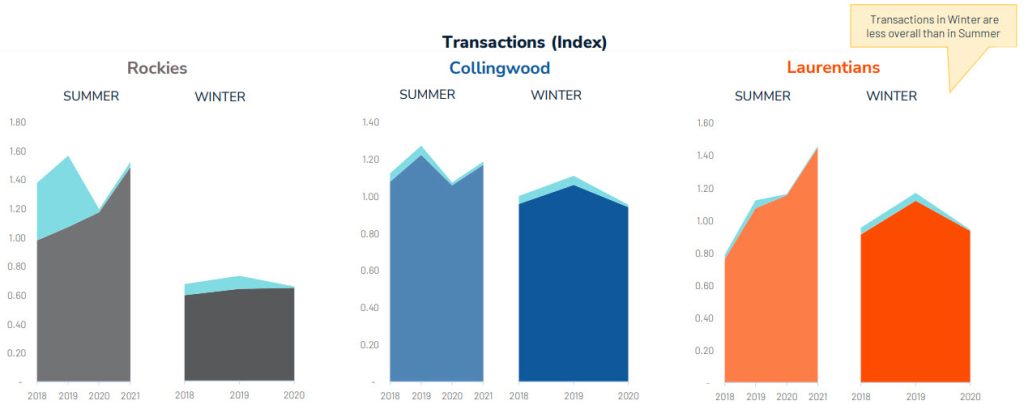
Transactions Generally Recovered Post-COVID Impact
- Visitors shopping and staying in these regions prior-to and during COVID made less transactions overall than they spent (previous slide), meaning the trend is to spend more and make fewer trips

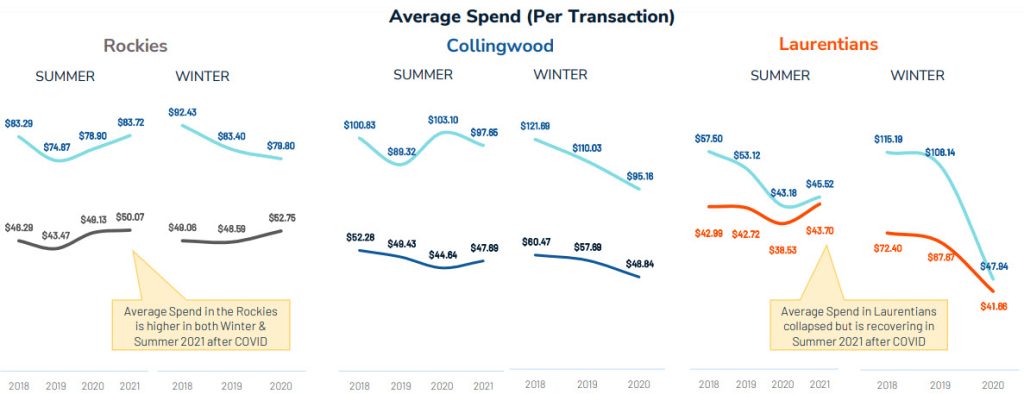
While Volume is Recovering, Average Spend Still Lower
- The Average Spend varied for Collingwood and Laurentians, less so for Rockies.
- March 2020 & January 2021 declines matched overall volume spend declines but March 2021 also declined

Retail and Hotels Have Recovered to Pre-COVID Highs
- The spending trend across all Tourist regions studied followed the overall aggregated trend
- Hotel and Entertainment had larger increases starting in March 2021 and moving into the summer

Consumer Location Analytics
Winter Key Opportunity for Recovery Across Markets
- The spending trend across all Tourist regions was decline during 2020, due to COVID
- Recovery in spend was higher in the Rockies and the Laurentians in Summer 2021
Domestic Spending Mitigated International Declines
- Declines in 2020 due to International visitors dropping were mitigated with Domestic consumer spending
- Collingwood and Laurentians have much fewer International visitors, with almost none in Quebec in 2021

International Transactions, Domestic & International
- International visitors spend more and have fewer transactions than Domestic spenders
- Transactions are much lower in Collingwood and Laurentians than spend
Loss of International Spend Impacting Recovery
- International visitors spend much more on average than Domestic spenders (nearly 2x)
- COVID caused declines in average spend during 2020 but is recovering in 2021
Laurentians captured Quebec Travelers During COVID
- Declines in 2020 occurred with those from the West, while higher spending came from QC FSAs

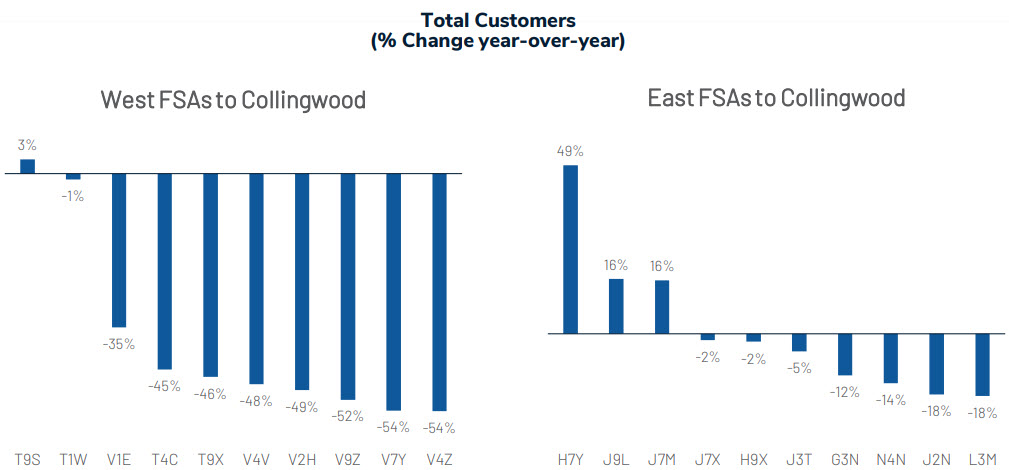
Collingwood captured Quebec Travelers During COVID
- Higher spending came from QC and ON FSAs in 2020
Rockies captured Alberta and BC Travelers During COVID
- Higher spending came from AB and BC FSAs in 2020

Average Nights-Stay is Trending Up in Laurentians

Average Nights-Stay is Trending Up in Collingwood

Average Nights-Stay is Mostly Unchanged for Rockies

Tourism Spending & Location Analytics Winter 2021
About Moneris Data Services

A comprehensive view of Canadian consumer spending
All payment types, card brands and digital wallets
All issuing banks including but not limited to:
Transaction Data Points
With a database of over 3.5 billion transactions, growing by 600 transactions per sec, Moneris captures 4 key data points on every transaction made on Moneris terminals
- Time
- Location
- Date
- Amount
Moneris Consumer Spending Data
Dimensions & Reporting
- Geo: National, Provincial, City, Postal Code, Street
- MCC Level: Total Spend, Industry Category, Industry Group, Custom
- Reporting Frequency: Weekly
- Delivery Frequency: Bi-weekly, Monthly, Quarterly, Snapshot
Moneris Consumer Spending Data
Spending Categories
- Total Spend
- MCC Industry (3)
- MCC Group (30)
- Household
- Alcohol
- Restaurant
- Apparel
- Department Stores
- Drug Stores
- Gas & Convenience
- Grocery
- Hotels
- Vehicle
- … and more