Black Friday and Cyber Monday have come and gone again, and we’re taking a look back at spending numbers from across the country. From the return of in-person shopping to the rise in apparel and vehicle sales, Black Friday and Cyber Monday are a positive spend story to end the year on.
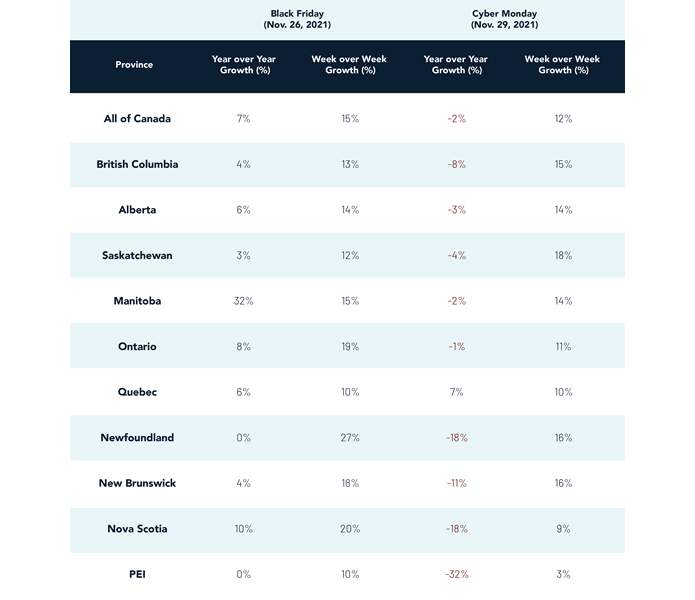
This Black Friday we saw a 7% increase in volumes year-over-year and a 15% increase week-over-week, with a peak of ~600 transactions/second at 3:40pm EST.
- This aligns with the usual peak spending time we see, which is between 2:00pm to 3:00pm.
- Consumers are excited to shop in person again and are back in brick-and-mortar stores with restrictions lifted compared to those last year.
- In 2020, Moneris saw 550 transactions per second at 2:45pm EST.
- On a normal Friday business day, we typically see a high of approximately 400 transactions per a second.
Moneris predicts that Black Friday was the Busiest Shopping Day of 2021.
- Black Friday has been the busiest shopping day of the year since 2019 when it overtook the Friday before Christmas and Boxing Day has been in third place for 5 years now.
- With the Friday before Dec. 25th being Christmas Eve this year, we are anticipating less last minute shopping than usual and more businesses choosing to close that day.
Holiday shopping started earlier this year with Cyber Monday volumes down a bit compared to 2020 (-2%) but spending increases throughout November.
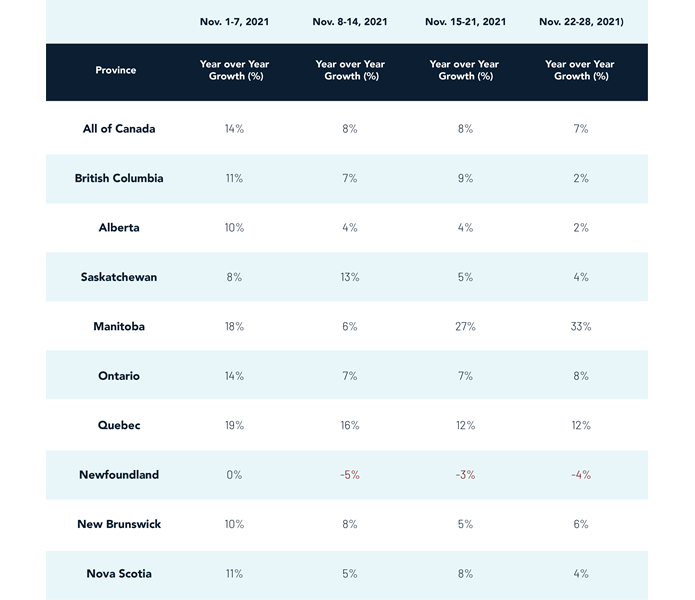
- There were positive year-over-year increases in spending the weeks leading up to both Black Friday and Cyber Monday.
- Given current supply chain issues and expected delivery delays, it’s unlikely that the lead-up to Christmas or Boxing Day will overtake Black Friday as consumers have been shopping even earlier in the year.
Black Friday vs. Cyber Monday 2021

About the data: Year-over-year volumes are based on a comparison of Black Friday dates (Nov. 26, 2021 vs. Nov. 27, 2020) Cyber Monday dates (Nov. 29 2021 vs. Nov. 30, 2020). Moneris spending reports measure spending in Canada across a range of categories by analyzing credit and debit card transaction data. The figures and percentages cited are derived from aggregated transaction volumes being processed by Moneris in the applicable categories.
Weekly November 2021 Volume Growth (Year-over-year)

About the data: Year-over-year growth volumes are based on a comparison of the week listed to the equivalent week in the year prior. Moneris spending reports measure spending in Canada across a range of categories by analyzing credit and debit card transaction data. The figures and percentages cited are derived from aggregated transaction volumes being processed by Moneris in the applicable categories.
Interested in making more informed business decisions with Moneris Data Services? Learn more at moneris.com.